Python教程-如何在Python中绘制图表

Python提供了一个最流行的绘图库,名为Matplotlib。它是一个开源的跨平台库,用于从数组中的数据创建2D图表。通常用于数据可视化和通过各种图表表示数据。
Matplotlib最初由John D. Hunter于2003年构思。最近版本的Matplotlib是2.2.0,于2018年1月发布。
在开始使用matplotlib库之前,我们需要在Python环境中安装它。
安装Matplotlib
在终端中输入以下命令并按回车键。
pip install matplotlib上述命令将在Windows操作系统上安装Matplotlib库及其依赖包。
Matplotlib的基本概念
一个图表包括以下部分。让我们了解这些部分。
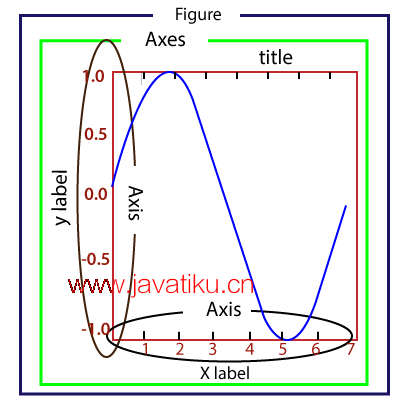
Figure(图): 它是一个整体的图表,可以包含一个或多个坐标轴(绘图区域)。我们可以将Figure想象成一个容纳绘图的画布。
Axes(坐标轴): 一个Figure可以包含多个Axes。每个Axes由一个标题、一个x标签和一个y标签组成。
Axis(轴): 轴是生成图表限制的线状对象的数量。
Artist(图形元素): 图形元素是我们在图表上看到的所有内容,如文本对象、Line2D对象和集合对象。大多数图形元素与坐标轴相关联。
pyplot简介
Matplotlib提供了pyplot包,用于绘制给定数据的图表。matplotlib.pyplot是一组命令风格函数,使Matplotlib工作像MATLAB一样。pyplot包含许多函数,用于创建图表、在图表中创建绘图区域、为图表添加标签、在绘图区域中绘制线条等等。
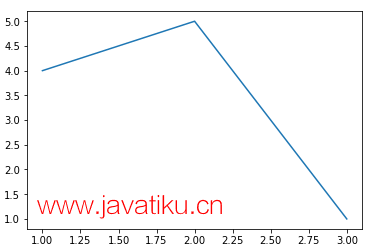
我们可以使用pyplot快速绘制图表。让我们看一个以下示例。
绘制基本图表的示例
以下是生成简单图表的基本示例;程序如下:
from matplotlib import pyplot as plt
#ploting our canvas
plt.plot([1,2,3],[4,5,1])
#display the graph
plt.show()
输出:
绘制不同类型的图表
我们可以使用pyplot模块绘制各种类型的图表。让我们了解以下示例。
1. 折线图
折线图用于以系列折线的方式显示信息。它易于绘制。考虑以下示例。
示例 -
from matplotlib import pyplot as plt

x = [1,2,3]
y = [10,11,12]

plt.plot(x,y)

plt.title("Line graph")
plt.ylabel('Y axis')
plt.xlabel('X axis')
plt.show()
输出:
可以使用各种函数来修改折线图,使图表更具吸引力。以下是一个示例。
示例 -
from matplotlib import pyplot as plt
from matplotlib import style

style.use('ggplot')
x = [10, 12, 13]
y = [8, 16, 6]
x2 = [8, 15, 11]
y2 = [6, 15, 7]
plt.plot(x, y, 'b', label='line one', linewidth=5)
plt.plot(x2, y2, 'r', label='line two', linewidth=5)
plt.title('Epic Info')
fig = plt.figure()
plt.ylabel('Y axis')
plt.xlabel('X axis')

plt.show()
2. 条形图
条形图是最常见的图表之一,用于表示与分类变量相关的数据。bar()函数接受三个参数 - 分类变量、数值和颜色。
示例 -
from matplotlib import pyplot as plt
Names = ['Arun','James','Ricky','Patrick']
Marks = [51,87,45,67]
plt.bar(Names,Marks,color = 'blue')
plt.title('Result')
plt.xlabel('Names')
plt.ylabel('Marks')
plt.show()
3. 饼图
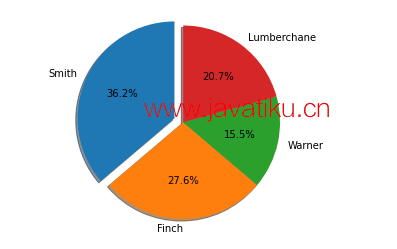
饼图是一个圆形图形,被分成子部分或片段。它用于表示每个部分的百分比或比例数据,其中饼图的每个切片代表一个特定的类别。让我们了解以下示例。
示例 -
from matplotlib import pyplot as plt

# Pie chart, where the slices will be ordered and plotted counter-clockwise:
Aus_Players = 'Smith', 'Finch', 'Warner', 'Lumberchane'
Runs = [42, 32, 18, 24]
explode = (0.1, 0, 0, 0)  # it "explode" the 1st slice

fig1, ax1 = plt.subplots()
ax1.pie(Runs, explode=explode, labels=Aus_Players, autopct='%1.1f%%',
        shadow=True, startangle=90)
ax1.axis('equal')  # Equal aspect ratio ensures that pie is drawn as a circle.

plt.show()
输出:
4. 直方图
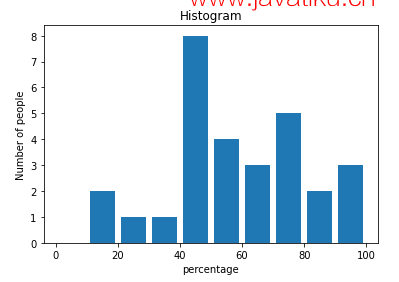
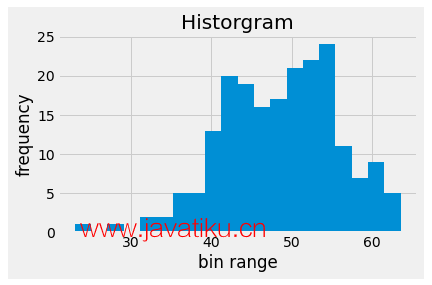
直方图和条形图非常相似,但它们之间有一点差异。直方图用于表示分布,而条形图用于比较不同实体。直方图通常用于绘制值的频率,与一组值范围相比。
在以下示例中,我们采用了不同学生的分数百分比数据,并绘制了关于学生人数的直方图。让我们了解以下示例。
示例 -
from matplotlib import pyplot as plt
from matplotlib import pyplot as plt
percentage = [97,54,45,10, 20, 10, 30,97,50,71,40,49,40,74,95,80,65,82,70,65,55,70,75,60,52,44,43,42,45]
number_of_student = [0,10,20,30,40,50,60,70,80,90,100]
plt.hist(percentage, number_of_student, histtype='bar', rwidth=0.8)
plt.xlabel('percentage')
plt.ylabel('Number of people')
plt.title('Histogram')
plt.show()
输出:
让我们了解另一个示例。
示例 - 2:
from matplotlib import pyplot as plt
# Importing Numpy Library
import numpy as np
plt.style.use('fivethirtyeight')

mu = 50
sigma = 7
x = np.random.normal(mu, sigma, size=200)
fig, ax = plt.subplots()

ax.hist(x, 20)
ax.set_title('Historgram')
ax.set_xlabel('bin range')
ax.set_ylabel('frequency')

fig.tight_layout()
plt.show()
输出:
5. 散点图
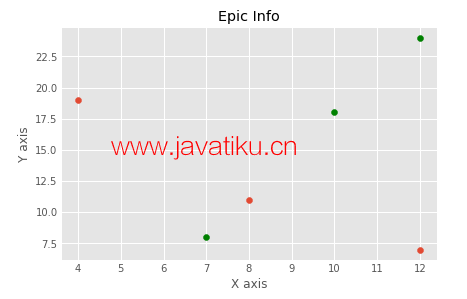
散点图用于比较一个变量与其他变量的关系。它定义了一个变量如何影响其他变量。数据表示为一组点。让我们了解以下示例。
示例 -
from matplotlib import pyplot as plt
from matplotlib import style
style.use('ggplot')

x = [4,8,12]
y = [19,11,7]

x2 = [7,10,12]
y2 = [8,18,24]

plt.scatter(x, y)

plt.scatter(x2, y2, color='g')

plt.title('Epic Info')
plt.ylabel('Y axis')
plt.xlabel('X axis')

plt.show()
输出:
示例 - 2:
import matplotlib.pyplot as plt
a = [2, 2.5, 3, 3.5, 4.5, 4.7, 5.0]
b = [7.5, 8, 8.5, 9, 9.5, 10, 10.5]

a1 = [9, 8.5, 9, 9.5, 10, 10.5, 12]
b1 = [3, 3.5, 4.7, 4, 4.5, 5, 5.2]
plt.scatter(a, b, label='high income low saving', color='b')
plt.scatter(a1, b1, label='low income high savings', color='g')
plt.xlabel('saving*100')
plt.ylabel('income*1000')
plt.title('Scatter Plot')
plt.legend()
plt.show()
输出:

在本教程中,我们讨论了数据可视化中常见的各种基本图表类型。要了解更多关于图表的信息,请访问我们的matplotlib教程。


