Python教程-用于机器学习的最佳Python库

机器学习是一门通过编程使计算机能够从不同类型的数据中学习的科学。根据机器学习的定义,由Arthur Samuel提出 - "研究领域,使计算机能够在没有明确编程的情况下学习"。机器学习的概念主要用于解决不同类型的现实问题。

在过去,用户通常通过手动编写所有算法并使用数学和统计公式来执行机器学习任务。与Python库、框架和模块相比,这个过程耗时、低效且繁琐。但在今天的世界,用户可以使用Python语言,这是机器学习最受欢迎和高效的语言。Python已经取代了许多其他编程语言,因为它具有丰富的库集合,可以使工作更加简单和容易。
在本教程中,我们将讨论用于机器学习的Python最佳库:
- NumPy
- SciPy
- Scikit-learn
- Theano
- TensorFlow
- Keras
- PyTorch
- Pandas
- Matplotlib
NumPy

NumPy是Python中最受欢迎的库。该库用于处理大型多维数组和矩阵,通过使用大量高级数学函数和公式进行计算。它主要用于机器学习中的基础科学计算。它广泛用于线性代数、傅立叶变换和随机数功能。还有其他高端库,如TensorFlow,它使用NumPy作为处理张量的内部功能。
示例:
import numpy as nup

# Then, create two arrays of rank 2
K = nup.array([[2, 4], [6, 8]])
R = nup.array([[1, 3], [5, 7]])

# Then, create two arrays of rank 1
P = nup.array([10, 12])
S = nup.array([9, 11])

# Then, we will print the Inner product of vectors
print ("Inner product of vectors: ", nup.dot(P, S), "\n")

# Then, we will print the Matrix and Vector product
print ("Matrix and Vector product: ", nup.dot(K, P), "\n")

# Now, we will print the Matrix and matrix product
print ("Matrix and matrix product: ", nup.dot(K, R))
输出:
Inner product of vectors: 222

Matrix and Vector product: [ 68 156]

Matrix and matrix product: [[22 34]
                                                   [46 74]]
SciPy

SciPy是机器学习开发人员中流行的库,它包含用于执行优化、线性代数、积分和统计的多个模块。SciPy库不同于SciPy堆栈,因为SciPy库是构成SciPy堆栈的核心包之一。SciPy库用于图像处理任务。
示例 1:
from scipy import signal as sg
import numpy as nup
K = nup.arange(45).reshape(9, 5)
domain_1 = nup.identity(3)
print (K, end = 'KK')
print (sg.order_filter (K, domain_1, 1))
输出:
r (K, domain_1, 1))
Output:
[[ 0  1  2  3  4]
 [ 5  6  7  8  9]
 [10 11 12 13 14]
 [15 16 17 18 19]
 [20 21 22 23 24]
 [25 26 27 28 29]
 [30 31 32 33 34]
 [35 36 37 38 39]
 [40 41 42 43 44]] KK [[ 0.  1.  2.  3.  0.]
 [ 5.  6.  7.  8.  3.]
 [10. 11. 12. 13.  8.]
 [15. 16. 17. 18. 13.]
 [20. 21. 22. 23. 18.]
 [25. 26. 27. 28. 23.]
 [30. 31. 32. 33. 28.]
 [35. 36. 37. 38. 33.]
 [ 0. 35. 36. 37. 38.]]
示例 2:
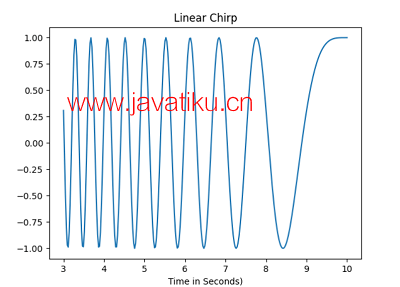
from scipy.signal import chirp as cp
from scipy.signal import spectrogram as sp
import matplotlib.pyplot as plot
import numpy as nup
t_T = nup.linspace(3, 10, 300)
w_W = cp(t_T, f0 = 4, f1 = 2, t1 = 5, method = 'linear')
plot.plot(t_T, w_W)
plot.title ("Linear Chirp")
plot.xlabel ('Time in Seconds)')
plot.show()
输出:

Scikit-learn

Scikit-learn是一个用于传统机器学习算法的Python库。它建立在两个基本的Python库NumPy和SciPy之上。Scikit-learn在机器学习开发人员中很受欢迎,它支持监督和无监督的学习算法。这个库还可以用于数据分析和数据挖掘过程。
示例:
from sklearn import datasets as ds
from sklearn import metrics as mt
from sklearn.tree import DecisionTreeClassifier as dtc

# load the iris datasets
dataset_1 = ds.load_iris()

# fit a CART model to the data
model_1 = dtc()
model_1.fit(dataset_1.data, dataset_1.target)
print(model)

# make predictions
expected_1 = dataset_1.target
predicted_1 = model_1.predict(dataset_1.data)

# summarize the fit of the model
print (mt.classification_report(expected_1, predicted_1))
print(mt.confusion_matrix(expected_1, predicted_1))
输出:
DecisionTreeClassifier()
              precision    recall f1-score   support

           0       1.00      1.00      1.00        50
           1       1.00      1.00      1.00        50
           2       1.00      1.00      1.00        50

    accuracy                           1.00       150
   macro avg       1.00      1.00      1.00       150
weighted avg       1.00      1.00      1.00       150

[[50  0  0]
 [ 0 50  0]
 [ 0  0 50]]
Theano

Theano是一个著名的Python库,用于定义、评估和优化数学表达式,还可以高效地涉及多维数组。
通过优化CPU和GPU的使用来实现。由于机器学习涉及数学和统计,Theano使用户能够轻松执行数学操作。
它被广泛用于大规模计算密集型科学项目。Theano是一个简单且易于使用的库,个人可以用于自己的项目。
示例:
import theano as th
import theano.tensor as Tt
k = Tt.dmatrix('k')
r = 1 / (1 + Tt.exp(-k))
logistic_1 = th.function([k], r)
logistic_1([[0, 1], [-1, -2]])
输出:
array([[0.5, 0.71135838],
       [0.26594342, 0.11420192]])
TensorFlow

TensorFlow是一个用于高性能数值计算的开源Python库。它是一种流行的库,由Google Brain团队开发。TensorFlow是一个框架,涉及定义和运行涉及张量的计算。TensorFlow用于训练和运行深度神经网络,可用于开发多种人工智能应用程序。
示例:
import tensorflow as tsf

# Initialize two constants
K_1 = tsf.constant([2, 4, 6, 8])
K_2 = tsf.constant([1, 3, 5, 7])

# Multiply
result = tsf.multiply(K_1, K_2)

# Initialize the Session
sess_1 = tsf.Session()

# Print the result
print (sess_1.run(result))

# Close the session
sess_1.close()
输出:
[ 2 12 30 56]Keras

Keras是一个高级神经网络API,可以在TensorFlow、CNTK和Theano等库之上运行。它在CPU和GPU上都可以顺畅运行。它为机器学习初学者和神经网络设计提供了非常简单和易用的工具。它还用于快速原型开发。
示例:
import numpy as nup
from tensorflow import keras as ks
from tensorflow.keras import layers as ls
number_classes = 10
input_shapes = (28, 28, 1)

# Here, we will import the data, and split it between train and test sets
(x_1_train, y_1_train), (x_2_test, y_2_test) = ks.datasets.mnist.load_data()

# now, we will Scale images to the [0, 1] range
x_1_train = x_1_train.astype("float32") / 255
x_2_test = x_2_test.astype("float32") / 255
# we have to make sure that the images have shape (28, 28, 1)
x_1_train = nup.expand_dims(x_1_train, -1)
x_2_test = nup.expand_dims(x_2_test, -1)
print ("x_train shape:", x_1_train.shape)
print (x_1_train.shape[0], "Training samples")
print (x_2_test.shape[0], "Testing samples")


# Then we will convert class vectors to binary class matrices
y_1_train = ks.utils.to_categorical(y_1_train, number_classes)
y_2_test = ks.utils.to_categorical(y_2_test, number_classes)
model_1 = ks.Sequential(
    [
        ks.Input(shape = input_shapes),
        ls.Conv2D(32, kernel_size = (3, 3), activation = "relu"),
        ls.MaxPooling2D(pool_size = (2, 2)),
        ls.Conv2D(64, kernel_size = (3, 3), activation = "relu"),
        ls.MaxPooling2D(pool_size = (2, 2)),
        ls.Flatten(),
        ls.Dropout(0.5),
        ls.Dense(number_classes, activation = "softmax"),
    ]
)

model_1.summary()
输出:
x_train shape: (60000, 28, 28, 1)
60000 Training samples
10000 Testing samples
Model: "sequential"
_________________________________________________________________
Layer (type)                 Output Shape              Param #
=================================================================
conv2d (Conv2D)              (None, 26, 26, 32)        320
_________________________________________________________________
max_pooling2d (MaxPooling2D) (None, 13, 13, 32)        0
_________________________________________________________________
conv2d_1 (Conv2D)            (None, 11, 11, 64)        18496
_________________________________________________________________
max_pooling2d_1 (MaxPooling2 (None, 5, 5, 64)          0
_________________________________________________________________
flatten (Flatten)            (None, 1600)              0
_________________________________________________________________
dropout (Dropout)            (None, 1600)              0
_________________________________________________________________
dense (Dense)                (None, 10)                16010
=================================================================
Total params: 34,826
Trainable params: 34,826
Non-trainable params: 0
_________________________________________________________________
PyTorch

PyTorch也是一个基于Torch的开源Python库,实现了C语言并用于机器学习。它具有多种工具和库,支持计算机视觉、自然语言处理(NLP)等各种机器学习任务。这个库还允许用户在GPU加速的张量上执行计算任务。
示例:
import torch as tch
d_type = tch.float
device_1 = tch.device("cpu")
# Use device = tch.device("cuda:0") for GPU

# Here, N_1 is batch size; D_in_1 is input dimension;
# H_1 is hidden dimension; D_out_1 is output dimension.
N_1 = 62
D_in_1 = 1000
H_1 = 110
D_out_1 = 11

# Now, we will create random input and output data
K = tch.randn(N_1, D_in_1, device = device_1, dtype = d_type)
R = tch.randn(N_1, D_out_1, device = device_1, dtype = d_type)

# Then, we will Randomly initialize weights
K_1 = tch.randn(D_in_1, H_1, device = device_1, dtype = d_type)
K_2 = tch.randn(H_1, D_out_1, device = device_1, dtype = d_type)

learning_rate_1 = 1e-6
for Q in range(500):
    # Now, we will put Forward pass: compute predicted y
    h_1 = K.mm(K_1)
    h_relu_1 = h_1.clamp(min = 0)
    y_pred_1 = h_relu_1.mm(K_2)

    # Compute and print loss
    loss = (y_pred_1 - R).pow(2).sum().item()
    print (Q, loss)

    # Then we will Backprop to compute gradients of w1 and w2 with respect to loss
    grad_y_pred = 2.0 * (y_pred_1 - R)
    grad_K_2 = h_relu_1.t().mm(grad_y_pred)
    grad_h_relu = grad_y_pred.mm(K_2.t())
    grad_h = grad_h_relu.clone()
    grad_h[h_1 < 0] = 0
    grad_K_1 = K.t().mm(grad_h)

    # Then we will Update the weights by using gradient descent
    K_1 -= learning_rate_1 * grad_K_1
    K_2 -= learning_rate_1 * grad_K_2
Pandas

Pandas是一个数据操作和分析的Python库。它具有多种数据结构,如数据帧和系列,用于处理和分析大型数据集。Pandas广泛用于数据清理、数据探索、数据可视化和数据分析。
示例:
import pandas as pad

data_1 = {"Countries": ["Bhutan", "Cape Verde", "Chad", "Estonia", "Guinea", "Kenya", "Libya", "Mexico"],
       "capital": ["Thimphu", "Praia", "N'Djamena", "Tallinn", "Conakry", "Nairobi", "Tripoli", "Mexico City"],
       "Currency": ["Ngultrum", "Cape Verdean escudo", "CFA Franc", "Estonia Kroon; Euro", "Guinean franc", "Kenya shilling", "Libyan dinar", "Mexican peso"],
       "population": [20.4, 143.5, 12.52, 135.7, 52.98, 76.21, 34.28, 54.32] }

data_1_table = pad.DataFrame(data_1)
print(data_1_table)
输出:
    Countries      capital             Currency  population
0      Bhutan      Thimphu             Ngultrum       20.40
1  Cape Verde        Praia  Cape Verdean escudo      143.50
2        Chad    N'Djamena            CFA Franc       12.52
3     Estonia      Tallinn  Estonia Kroon; Euro      135.70
4      Guinea      Conakry        Guinean franc       52.98
5       Kenya      Nairobi       Kenya shilling       76.21
6       Libya      Tripoli         Libyan dinar       34.28
7      Mexico  Mexico City         Mexican peso       54.32
Matplotlib

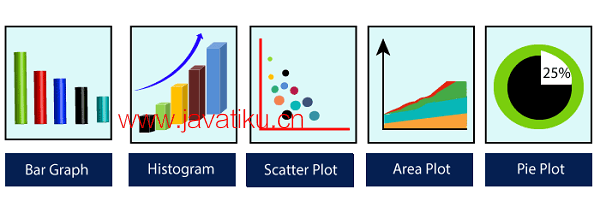
Matplotlib是一个用于创建2D图表和图形的Python库。它可以生成直方图、功率谱、条形图、误差图、散点图、非常详细的图表等。Matplotlib广泛用于数据可视化,因为它可以轻松生成高质量的图表。
示例:
import matplotlib.pyplot as plot
import numpy as nup

# Prepare the data
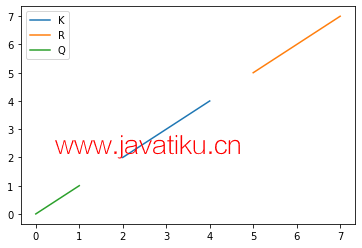
K = nup.linspace(2, 4, 8)
R = nup.linspace(5, 7, 9)
Q = nup.linspace(0, 1, 3)

# Plot the data
plot.plot(K, K, label = 'K')
plot.plot(R, R, label = 'R')
plot.plot(Q, Q, label = 'Q')

# Add a legend
plot.legend()

# Show the plot
plot.show()
输出:

这些是用于机器学习的一些最佳Python库。每个库都有其自己的用途,可以根据特定的任务和需求选择合适的库。例如,NumPy和SciPy用于基本数学运算,Scikit-learn用于传统机器学习算法,TensorFlow和PyTorch用于深度学习,Keras用于快速原型开发,Pandas用于数据操作和分析,Matplotlib用于数据可视化。根据您的项目和目标,选择适合您的库。


